Configuring Custom Metrics, KRIs and QTLs
This guide provides detailed instructions on how to upload and structure custom metric data files in the form of <UniqueMetricName>.dynmetric.json files. Custom metrics are used to track various study-related data over time, and it is important to follow specific guidelines when preparing and uploading these files.
Table of Contents
- Introduction
- File Naming Convention
- Metric Data: File Structure and Content
- Metadata: File Structure and Content
- Adding Reports
- Data Import
- Data Reprocessing
1. Introduction
Custom metric data can be a crucial part of your study data, allowing you to track various custom metrics over time. To ensure successful data management, follow the guidelines outlined below when uploading and structuring custom metric data files.

2. File Naming Convention
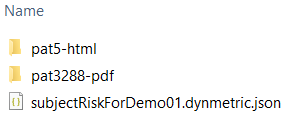
- Filename: Each custom metric data file should have this format: <UniqueMetricName>.dynmetric.json.
- File Extension: The file extension must always be .dynmetric.json.
- Unique Metric Name: The <UniqueMetricName> must be a distinctive name for your metric and must not contain underscores. It should be unique across all custom metrics.
- Zip Archive: To upload your custom metric data, you must create a zip archive containing all the relevant .dynmetric.json files. This zip archive should also include other study data files, if applicable.

3. Metric Data: File Structure and Content
This section explains the json structure for the metric data. How to set the metadata for the metric, KRI and QTL is described in the next section.
Each *.dynmetric.json file should adhere to the following structure:
{
   "Data": [
      {
          "ValueTime": "<Timestamp>",
          "EntityType": "<Entity>",
          "ExternalKey": "<Key>",
          "DataPoint": {
             "Value": <Value>,
             "ValueExplanation": "<ValueExplanation>",
             "Reports": [
                {
                  "RelativeFilePath": "<RelativeFilePath>",
                  "Name": "<Name>",
                  "Description": "<Description>",
                  "MimeType": "<MimeType>",
                  "IsRoot": <IsRoot>
               },
            // Additional reports can be added here
            ]
         }
      },
      // Additional data points can be added here
   ]
}
- The root element must be “Data” and is a list of metric data points.
- <Timestamp>: The timestamp represents the time of the metric value in ISO 8601 format (e.g., “2011-04-23T18:25:43.000Z”).
- <Entity>: The “EntityType” specifies the level of the metric data and can be one of the following: study, country, site, patient, or visit.
-
<Key>: The “ExternalKey” should be in sync with the ExternalKey used in the study.

Example of External Keys - <Value>: “Value” represents the actual metric value for the data point.
- <ValueExplanation>: here you can add text that explains how the values was calculated.
4. Metadata: File Structure and Content
Additionally to the actual metric data also the metrics, KRI and QTL metadata can be added to the same *.dynmetric.json file.
The metadata describes the metric, KRI and QTL and the information will be visible in MyRBQM.
4.1 Metric Metadata
{
    "MetricMetadata": {
        "DisplayId": "<DisplayId>",
        "DisplayName": "<DisplayName>",
        "Unit": "<Unit>",
        "Version": "<Version>",
        "Category": "<Category>",
        "Description": "<Description>",
        "CalcDetails": "<CalcDetails>",
        "ShowOnDashboard": <ShowOnDashboard>,
        "Levels": [
            "study",
            "country",
            "site"
        ]
    },
    "Data": ... // described in previous section
}
MetricMetadata Description
A list of KRI and QTL metadata descriptions.
- DisplayId: A unique identifier for the metric displayed.
- DisplayName: The name of the metric as it appears on the dashboard or reports.
- Unit: The measurement unit for the metric (e.g., count, percentage).
- Version: The version of the metric, useful for tracking changes or updates.
- Category: The category or grouping to which the metric belongs (e.g., safety, performance).
- Description: A brief description of what the metric measures and its purpose.
- CalcDetails: Detailed information about how the metric is calculated.
- ShowOnDashboard: A boolean value (true or false) indicating whether the metric should be displayed on the dashboard.
- Levels: A list of levels at which the metric can be applied (e.g., study, country, site).
4.2 KRI Metadata
{
    "KriQtlMetadata": [
        {
            "DisplayId": "<display_id>",
            "DisplayName": "<display_name>",
   	    "Type": "Kri",
            "Version": "<version>"
	    "CalcDetails": "<calc_details>",
            "CalculationMethod": "<calculation_method>",
            "Category": "<category>",
            "Description": "<description>",
            "Direction": "<direction>",
            "Levels": [
                {
                    "Config": {
                        "AlertsMuted": "<alerts_muted>",
                        "PlannedValueConstant": "<planned_value_constant>",
                        "ResultsMuted": "<results_muted>",
                        "ThresholdForHighAlertLevel": "<threshold_for_high_alert_level>",
                        "ThresholdForMediumAlertLevel": "<threshold_for_medium_alert_level>",
                        "TicketAutoClose": "<ticket_auto_close>",
                        "TicketCreationTimeout": "<ticket_creation_timeout>"
                    },
                    "Level": "study"
                }
            ],

        }
    ],
    "MetricMetadata": ... // described in previous sections
    "Data": ... // described in previous sections
}
KriQtlMetadata Description
- Type: Specifies the type. Possible values:
- Kri
- Qtl
- DisplayId: A unique identifier for the KRI or QTL.
- DisplayName: The name of the KRI or QTL as displayed in user interfaces.
- CalculationMethod: Describes the methodology used to calculate the KRI or QTL. Possible values:
- CompareToThreshold
- CompareToThresholdWithLag
- Version: Indicates the version of the KRI or QTL definition.
- Category: Categorizes the type of risk the KRI or QTLaddresses.
- Description: Provides a brief explanation of what the KRI measures and its relevance.
- CalcDetails: Details the formula or process used in the calculation of the KRI or QTL.
- Direction: Specifies whether a higher or lower value indicates a greater risk. Possible values:
- higher
- lower
- Levels: Lists the organizational levels at which the KRI applies, with specific configurations:
-
Level: Specifies the level (e.g., study, country, site).
Config: Configuration details for the level, including:
- AlertsMuted: Optional, boolean value, indicating whether alerts are muted at this level.
- PlannedValueConstant: Optional, a constant decimal value used in KRI calculations.
- ResultsMuted: Optional, boolean value, indicating whether results are muted at this level.
- ThresholdForHighAlertLevel: Mandatory, the decimal value threshold that triggers a high alert.
- ThresholdForMediumAlertLevel: Optional, the decimal value threshold that triggers a medium alert.
- TicketAutoClose: Optional, boolean value, indicating whether tickets automatically close after a certain period.
- TicketCreationTimeout: Optional, the time frame within which a ticket must be addressed. Possible values:
- none,
- day,
- week,
- two weeks,
- month,
- quarter,
- half of year,
- year
-
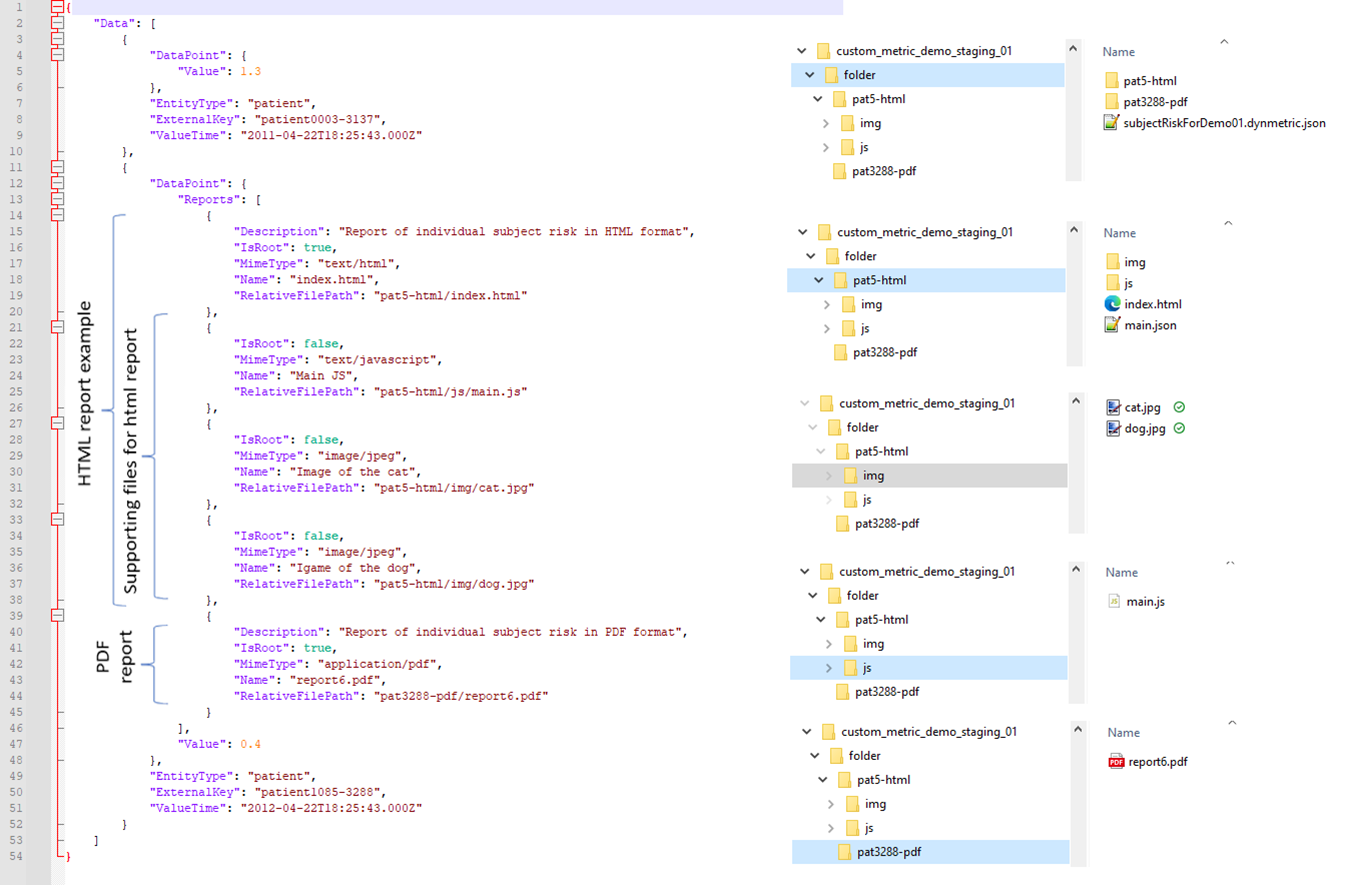
5. Adding Reports
You can include PDF and HTML reports associated with your custom metric data. These reports will be visible on the metric page. Each report should be structured as follows:
{
   "RelativeFilePath": "<RelativeFilePath>",
   "Name": "<Name>",
   "Description": "<Description>",
   "MimeType": "<MimeType>",
   "IsRoot": <IsRoot>
}
- <RelativeFilePath> (mandatory): The actual filename including the relative path of the report.
- <Name> (optional): The name of the report.
- <Description> (optional): A brief description of the report.
- <MimeType> (mandatory): The MIME type of the report (e.g., “text/html,” “application/pdf”).
- <IsRoot> (mandatory): Set to true if the report is the root report; otherwise, set it to false.
- IsRoot: true => core report file,
- IsRoot: false => supporting files for report (pics, scripts etc.)
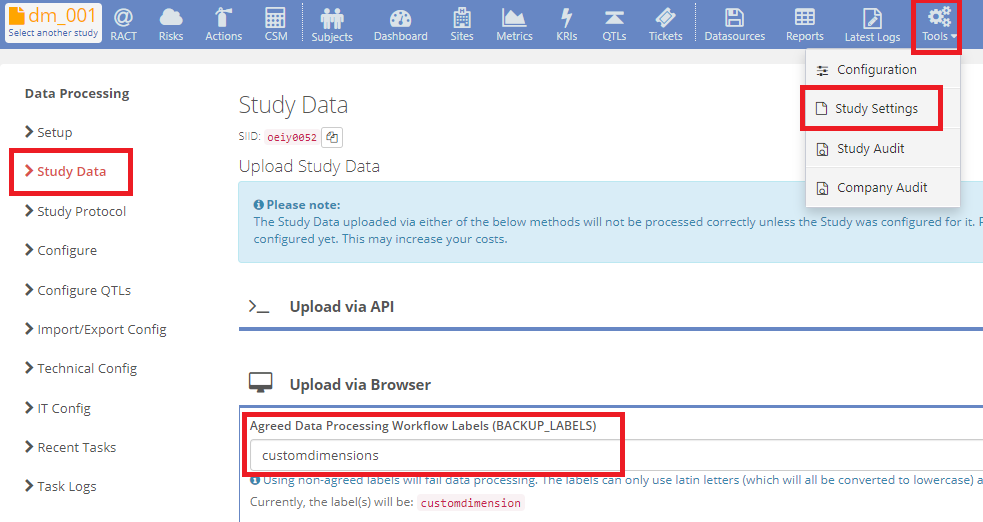
6. Data Import
There are two ways to upload your zip archive containing all .dynmetric.json files and reports:
- Along with other study data through the regular data import process
- Separately, using customdimensions label in the data upload form field "Agreed Data Processing Workflow Labels" (as in the screenshot below). This will only import dynmetrics (and not other data) and will be quicker as the regular data import.
After data upload and successful data processing, check the correct visibility of the custom metrics and KRI/QTL as defined in the dynmetric.json file
8. Data Reprocessing
To ensure that your custom metric data is accurately reflected in your study data, it is important to reprocess the latest data import . You can initiate the reprocessing of the latest import by going to Study Settings -> Study Data page and selecting Re-process from this data package:

Note: Because of the intricacies of the software architecture, it is necessary for the Study Type to facilitate the import of custom metrics data (DynamicDataImport). If you're uncertain whether the Study Types deployed within your company support this feature, please contact Cyntegrity or refer to the Data Processing Specification in MyRBQM specific to your study and look up "DynamicDataImport". If you find this term, your study supports the data import of custom metrics.