Algorithm Details: Interquartile Range (IQR)
interquartile range is a measure of statistical dispersion to show where the middle fifty is in a data set. In general, Interquartile range method is adjusted for skewed distributions with box plot, where three quartiles Q1,Q2 and Q3 divide the box plot into four sections. The interquartile range formula is the first quartile (25%) subtracted from the third quartile (75%), i.e, IQR=IQR3(75%) - IQR1(25%).
IQR is used in this case for univariate outliers detection to identify the values of numerical variables which are abnormally distant from most of the observations to detect data collection errors, sloppy data or fraud. For every selected variable, IQR box plot algorithm:
- Calculates (1) box plot properties: the extreme of the lower whisker, the lower hinge, the median, the upper hinge and the extreme of the upper whisker for one group/plot. If grouping variable is set, these properties are calculated for each group. If not implemented, there is only one box plot for all the data of the variable. (2) list of outlier values of variables and inlier points inside the whiskers.
-
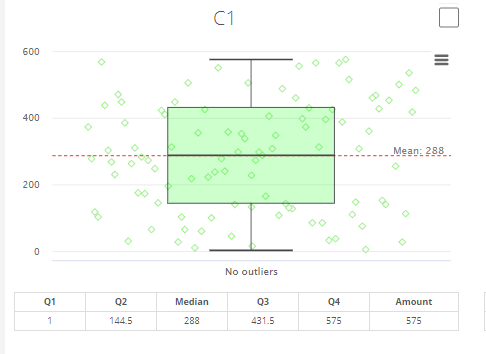
Collects the result for the variable with (1) Display of box plot with whiskers https://www.highcharts.com/docs/chart-and-series-types/box-plot-serieshttps://jsfiddle.net/6y5Lr0vm/ Box on the plot contains solid line for median and dashed line for mean. (2) Outliers are displayed outside the box as points (small circles). If there is a small amount of outliers, they are displayed on a vertical central line. If there is a big amount of outliers, then they are displayed with jitter. The more outliers are there, the bigger is the jitter (see “All Points” on pic.).

[1] Hubert, M. and Vandervieren, E. (2008). An adjusted boxplot for skewed distributions. In Computational Statistics and Data Analysis 52, 5186-5201.(https://wis.kuleuven.be/stat/robust/papers/2008/adjboxplot-revision.pdf)
[2] InterQuartile Range (IQR) explanation - SPH - Boston University. (http://sphweb.bumc.bu.edu/otlt/mph-modules/bs/bs704_summarizingdata/bs704_summarizingdata7.html)
[3] https://www.statisticshowto.datasciencecentral.com/probability-and-statistics/interquartile-range/